Stock Market Basic to Advance - Lecture 5
( Price action, Support & resistance, Breakout and breakdown)
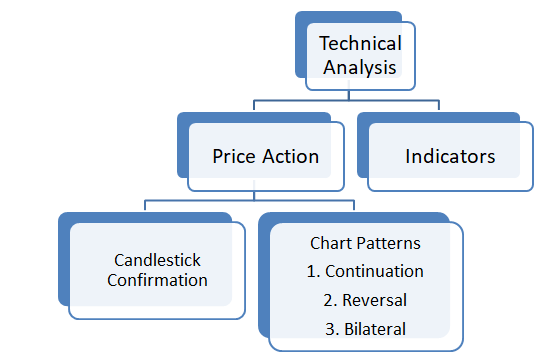
Price action Analysis
Price action analysis is a cornerstone of technical analysis, focusing on understanding price movements without relying heavily on indicators. It revolves around the idea that all relevant information is reflected in price movements, making it crucial to analyze and interpret these movements accurately for informed decision-making in trading.
Key Points:
Market Dynamics: Price action analysis delves into the psychology of market participants, emphasizing the interaction between supply and demand. It recognizes that price movements are driven by the balance between buyers and sellers' actions in the market.
Predictive Nature: Traders use past price data to forecast potential future price movements. By identifying patterns, trends, and key levels of support and resistance, they aim to anticipate where prices may head next.
Factors Influencing Price Action:
Volume: Trading volume provides insights into the strength of price movements. Higher volume often accompanies significant price changes, confirming the validity of the trend.
Patterns: Chart patterns, such as triangles, head and shoulders, and flags, emerge from market participants' behavior and offer clues about potential future price movements.
Candlestick Analysis: Candlestick patterns visually represent price action within specific time frames, offering valuable insights into market sentiment and potential reversal points.
Supply and Demand Zones: Identifying areas of significant supply (resistance) and demand (support) helps traders anticipate how prices may react when they reach these levels.
Market Direction: Determining the prevailing trend or direction of the market is essential. Traders use tools like moving averages and trendlines to identify the overall direction of price movement.
Limitations of Indicators:
While technical indicators can complement price action analysis, they have limitations. Indicators rely on mathematical formulas applied to price and volume data, which may lag behind actual price movements. Moreover, they can generate false signals, particularly in choppy or sideways markets.
Price action analysis is fundamental to technical analysis, providing traders with insights into market behavior and potential future price movements. By understanding and interpreting price movements alongside factors like volume, patterns, and supply and demand dynamics, traders can make more informed trading decisions. While indicators have their place, traders should not solely rely on them and instead prioritize understanding and analyzing price action for effective trading strategies.
What is Support and Resistance ?
Support and resistance are fundamental concepts in technical analysis that play a vital role in identifying key levels on a price chart where significant buying and selling pressures converge.
Support:
Definition: Support refers to a price level at which a security finds sufficient buying interest to prevent further decline. It represents a zone where demand exceeds supply, leading to a bounce in the price.
Key Characteristics:
- Price Bounce: When the price reaches a support level, it tends to bounce as buyers perceive the price as attractive and step in to buy, halting the downtrend.
- Demand Level: Support zones typically indicate areas of increased buying interest, reflecting a strong demand for the security.
- Buying Pressure: At support levels, buying pressure surpasses selling pressure, causing the price to rebound.
Resistance:
Definition: Resistance, on the other hand, represents a price level at which a security encounters selling pressure, preventing further ascent. It denotes a zone where supply exceeds demand, leading to a reversal in the price.
Key Characteristics:
- Price Rejection: When the price reaches a resistance level, it tends to face rejection as sellers view the price as overvalued and step in to sell, halting the uptrend.
- Supply Level: Resistance zones typically indicate areas of increased selling interest, reflecting a strong supply of the security.
- Selling Pressure: At resistance levels, selling pressure exceeds buying pressure, causing the price to reverse downward.
Summary:
Support and resistance levels serve as crucial reference points for traders in identifying potential entry and exit levels for trades. Understanding these levels helps traders anticipate price movements and make informed trading decisions. Support signifies areas of buying interest, where the price is likely to bounce upward, while resistance denotes areas of selling interest, where the price may reverse downward. Incorporating support and resistance analysis into trading strategies can enhance trading effectiveness and decision-making processes.
- Support and Resistance Identification: Support levels are characterized by a halt in downward price movement, followed by a bounce back, while resistance levels indicate a barrier to upward movement, resulting in a reversal downwards.
- Trading in Consolidation Zones: Consolidation zones present challenges as price movements lack clear direction, with buyers and sellers establishing positions. Retail traders often struggle in these zones due to the absence of a definitive trend.
- Breakout Trading Opportunities: Breakouts occur when price breaches support or resistance levels, signaling potential shifts in market sentiment. These breakouts typically lead to decisive and rapid price movements.
- Illustrative Example: Imagine a market confined within a consolidation zone. Attempts to push prices higher are met with selling pressure, causing reversals. Conversely, buying pressure emerges when prices drop, leading to upward movements.
- Impact of Breakouts: Breakouts from consolidation zones indicate significant shifts in market dynamics. If buying pressure overwhelms resistance, sellers may face losses and switch to buying, fueling upward momentum. Conversely, prevailing selling pressure leads to rapid downward movements.
Understanding these dynamics is crucial for traders to effectively navigate support, resistance, consolidation zones, and breakout trading strategies, enabling them to capitalize on emerging market trends.
In price action analysis, it's crucial to exercise caution when considering trades following breakouts from consolidation zones. There's a risk of fake breakouts orchestrated by institutional investors, potentially leading to losses for retail traders. It's prudent to await clear confirmation from price action before entering trades.
Stock Market Basic to Advance - Lecture 5 ( Price action, Support & resistance, Breakout and breakdown)
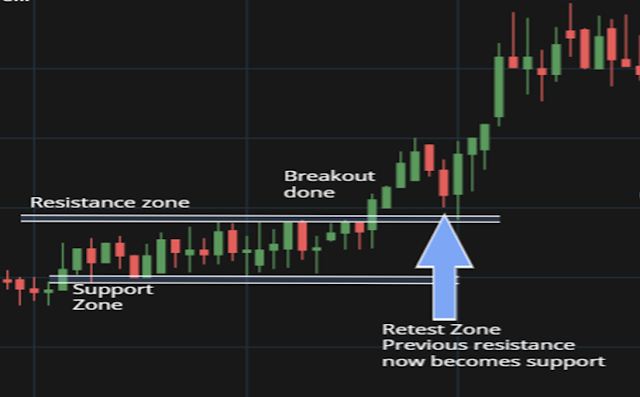
In the provided chart, notice the initial movement of prices within a particular range. A breakout occurs when the resistance zone is convincingly breached by a strong green candle, indicating robust buying pressure. However, prices may retract back into the consolidation zone afterward.
During this retracement, the previous resistance level often transitions into a support level. To validate this support, watch for the formation of another strong green candle at this level. If such a candle emerges, signaling sustained buying pressure and confirming the support, it presents a reliable entry opportunity.
By exercising patience and awaiting clear price action confirmation, traders can mitigate the risk of falling for fake breakouts and increase the likelihood of successful trades. This approach ensures that trades are based on dependable signals, enhancing the chances of reaching the target
Note:
v Old resistance becomes new support after breakout.
v Old support becomes new resistance after
breakdown.
v Gap Up opening means if market opens high from previous session closing point then it is caller as Gap Up Opening.
v Gap Down Opening means
if market opens from previous session closing point then it is called as gap
down opening.


